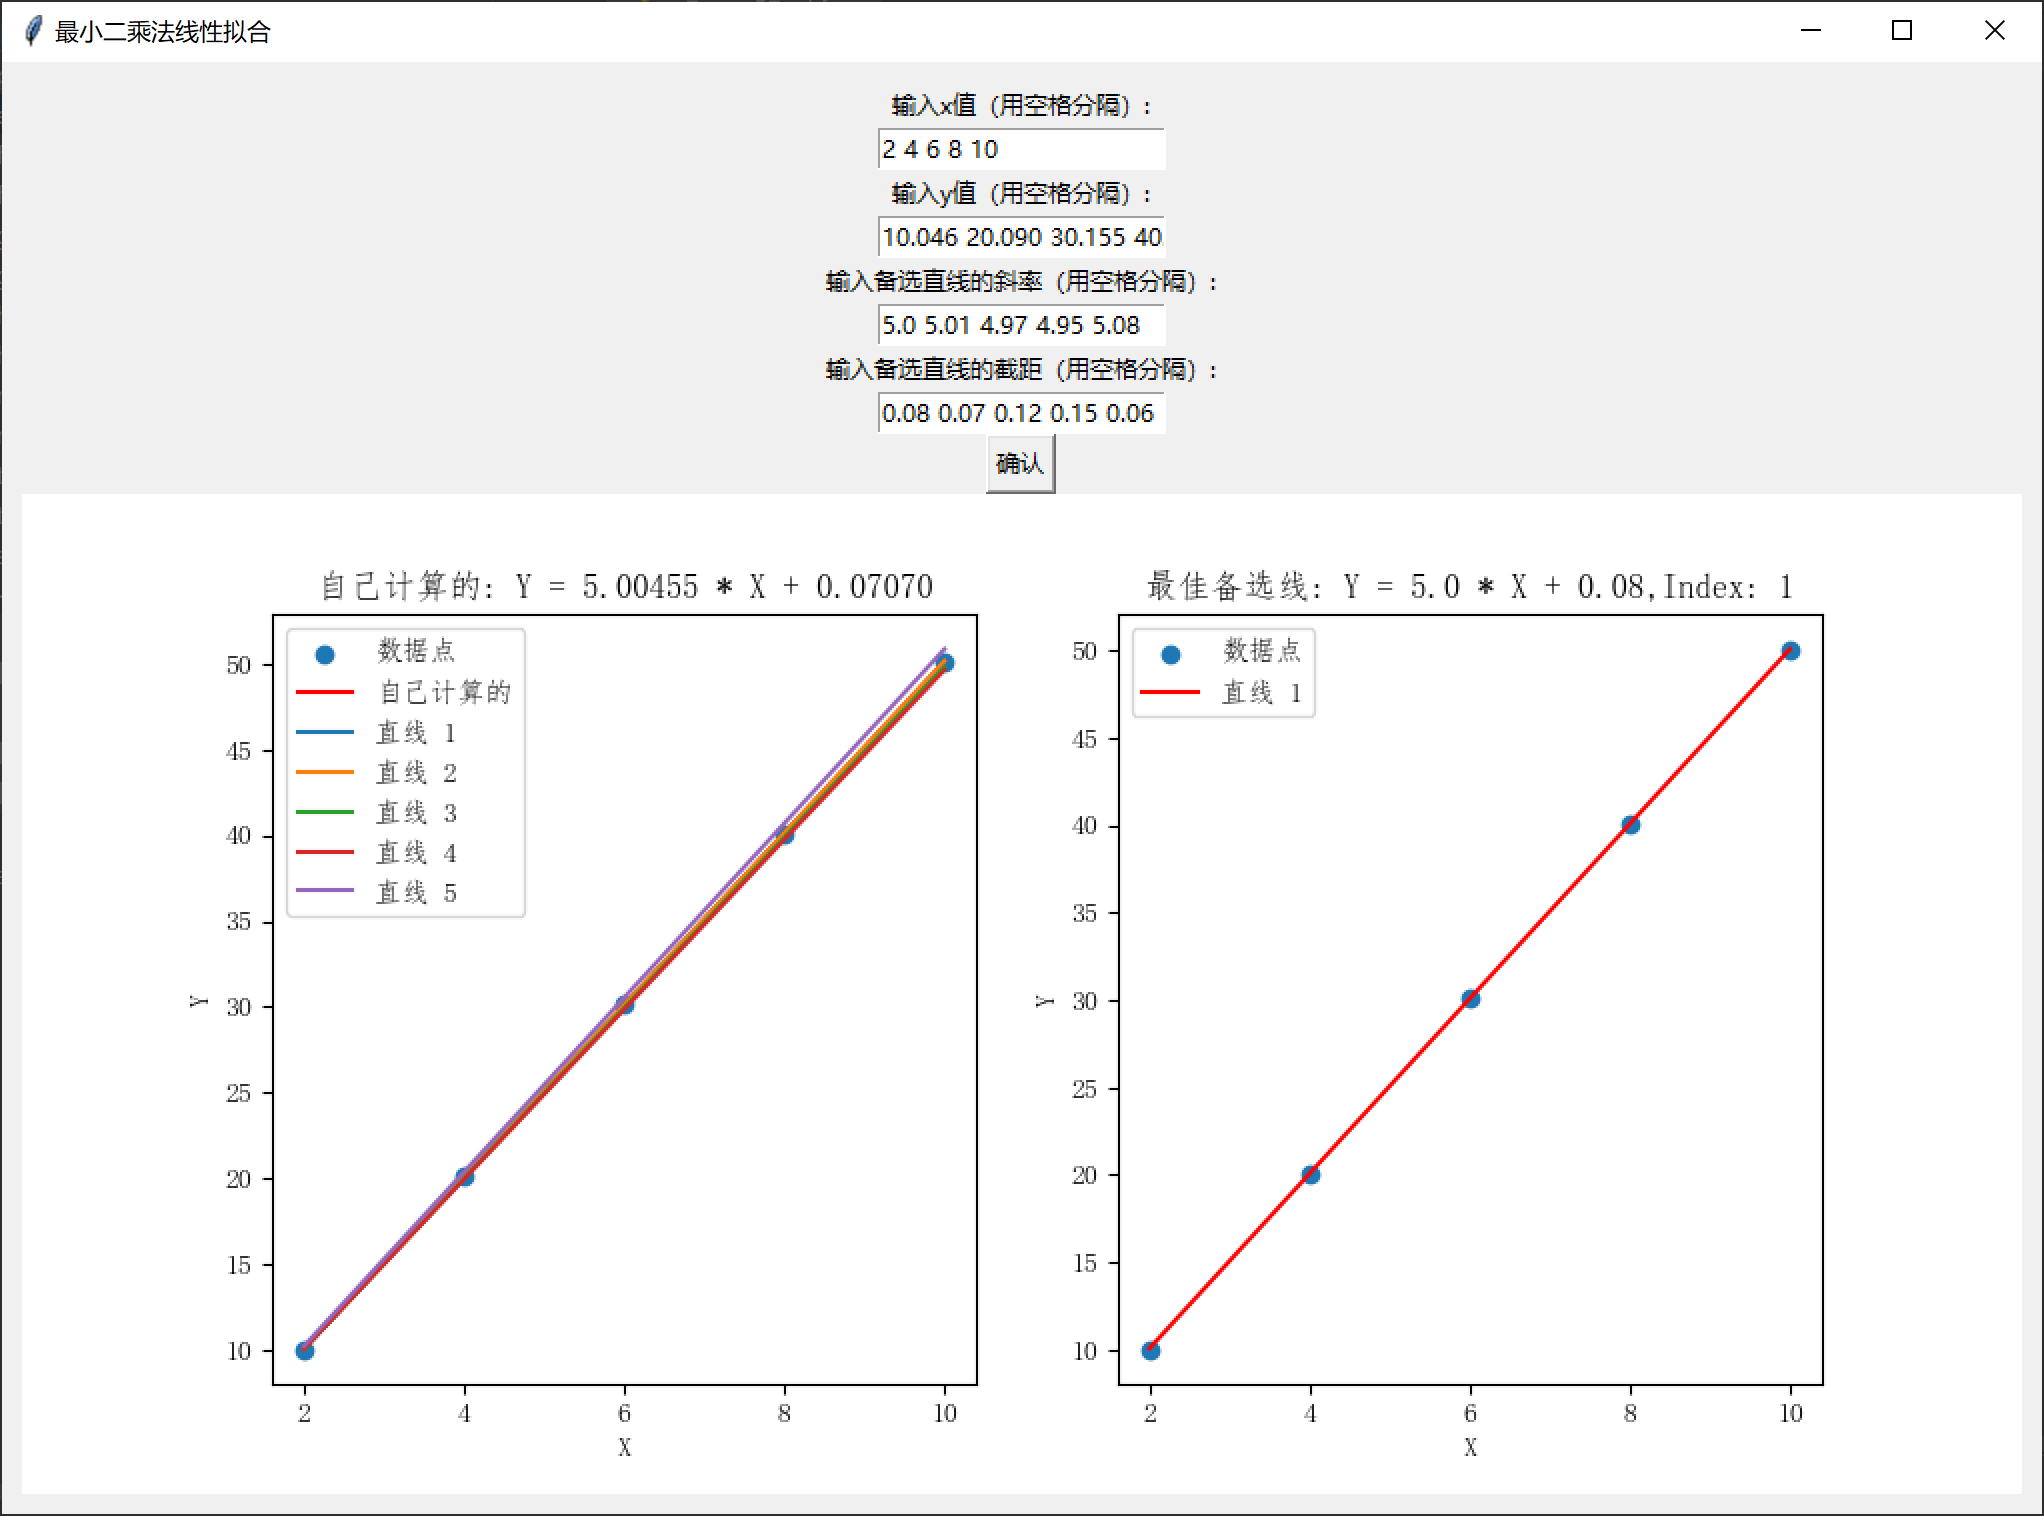
最小二乘法,可视化UI界面
python展开代码import tkinter as tk
import numpy as np
import matplotlib.pyplot as plt
from matplotlib.backends.backend_tkagg import FigureCanvasTkAgg
from pylab import mpl
mpl.rcParams['font.sans-serif'] = ['FangSong']  # 指定默认字体
mpl.rcParams['axes.unicode_minus'] = False  # 解决保存图像是负号'-'显示为方块的问题
# 函数用于执行最小二乘法线性拟合
def linear_regression():
    x_values = [float(x) for x in x_entry.get().split()]
    y_values = [float(y) for y in y_entry.get().split()]
    A = np.vstack([x_values, np.ones(len(x_values))]).T
    m, c = np.linalg.lstsq(A, y_values, rcond=None)[0]
    # 清空画布
    ax[0].clear()
    ax[1].clear()
    # 绘制数据点
    ax[0].scatter(x_values, y_values, label='数据点')
    # 绘制最小二乘法拟合线
    ax[0].plot(x_values, m * np.array(x_values) + c, 'r', label='自己计算的')
    ax[0].set_title(f'自己计算的: Y = {m:.5f} * X + {c:.5f}')
    # 从斜率和截距输入框获取备选直线的参数
    lines_m = [float(m) for m in m_entry.get().split()]
    lines_c = [float(c) for c in c_entry.get().split()]
    # 绘制备选直线
    for i in range(len(lines_m)):
        ax[0].plot(x_values, lines_m[i] * np.array(x_values) + lines_c[i], label=f'直线 {i + 1}')
    # 计算备选直线中最好的拟合直线,得到是哪一条直线最好
    best_line_index = np.argmin([np.sum(np.square(y_values - (m * np.array(x_values) + c))) for m, c in
                                 zip(lines_m, lines_c)])
    ax[0].set_xlabel('X')
    ax[0].set_ylabel('Y')
    ax[0].legend()
    # 在ax[1]绘制最好的直线
    ax[1].scatter(x_values, y_values, label='数据点')
    ax[1].plot(x_values, lines_m[best_line_index] * np.array(x_values) + lines_c[best_line_index], 'r',
               label=f'直线 {best_line_index + 1}')
    ax[1].set_title(
        f'最佳备选线: Y = {lines_m[best_line_index]} * X + {lines_c[best_line_index]},Index: {best_line_index + 1}')
    ax[1].set_xlabel('X')
    ax[1].set_ylabel('Y')
    ax[1].legend()
    canvas.draw()
# 创建Tkinter窗口
root = tk.Tk()
root.title('最小二乘法线性拟合')
frame = tk.Frame(root)
frame.pack(padx=10, pady=10)
# 创建输入框和标签
x_label = tk.Label(frame, text='输入x值(用空格分隔):')
x_label.pack()
x_entry = tk.Entry(frame)
x_entry.insert(0, '2 4 6 8 10')  # 设置默认值
x_entry.pack()
y_label = tk.Label(frame, text='输入y值(用空格分隔):')
y_label.pack()
y_entry = tk.Entry(frame)
y_entry.insert(0, '10.046 20.090 30.155 40.125 50.074')  # 设置默认值
y_entry.pack()
m_label = tk.Label(frame, text='输入备选直线的斜率(用空格分隔):')
m_label.pack()
m_entry = tk.Entry(frame)
m_entry.insert(0, '5.0 5.01 4.97 4.95 5.08')  # 设置默认值
m_entry.pack()
c_label = tk.Label(frame, text='输入备选直线的截距(用空格分隔):')
c_label.pack()
c_entry = tk.Entry(frame)
c_entry.insert(0, '0.08 0.07 0.12 0.15 0.06')  # 设置默认值
c_entry.pack()
# 创建确认按钮
calculate_button = tk.Button(frame, text='确认', command=linear_regression)
calculate_button.pack()
# 创建大画布
fig, ax = plt.subplots(1, 2, figsize=(10, 5))
canvas = FigureCanvasTkAgg(fig, master=frame)
canvas.get_tk_widget().pack()
canvas.draw()
# 运行Tkinter主循环
root.mainloop()
如果对你有用的话,可以打赏哦
打赏


本文作者:Dong
本文链接:
版权声明:本博客所有文章除特别声明外,均采用 CC BY-NC。本作品采用《知识共享署名-非商业性使用 4.0 国际许可协议》进行许可。您可以在非商业用途下自由转载和修改,但必须注明出处并提供原作者链接。 许可协议。转载请注明出处!