Opencv 颜色过滤 Python mask 选取颜色 颜色直方图
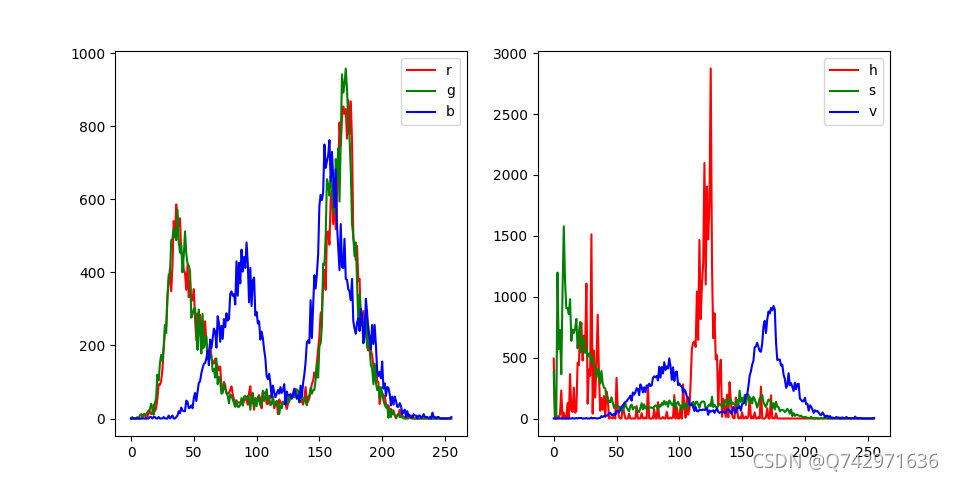
截图目标,分析目标的颜色直方图:
python展开代码import cv2
from matplotlib import pyplot as plt
def show_img(path):
    img = cv2.imread(path)
    b, g, r = img[:, :, 0], img[:, :, 1], img[:, :, 2]
    hist_b = cv2.calcHist([b], [0], None, [256], [0, 256])
    hist_g = cv2.calcHist([g], [0], None, [256], [0, 256])
    hist_r = cv2.calcHist([r], [0], None, [256], [0, 256])
    plt.figure(figsize=(10, 5))
    plt.subplot(121)
    plt.plot(hist_r, color='r', label="r")
    plt.plot(hist_g, color='g', label="g")
    plt.plot(hist_b, color='b', label="b")
    plt.legend()
    img2 = cv2.cvtColor(img, cv2.COLOR_BGR2HSV)
    h, s, v = img2[:, :, 0], img2[:, :, 1], img2[:, :, 2]
    hist_h = cv2.calcHist([h], [0], None, [256], [0, 256])
    hist_s = cv2.calcHist([s], [0], None, [256], [0, 256])
    hist_v = cv2.calcHist([v], [0], None, [256], [0, 256])
    plt.subplot(122)
    plt.plot(hist_h, color='r', label="h")
    plt.plot(hist_s, color='g', label="s")
    plt.plot(hist_v, color='b', label="v")
    plt.legend()
    plt.show()
    return hist_r, hist_g, hist_b, hist_h, hist_s, hist_v
r, g, b, h, s, v = show_img("lanse.png")
展开代码import cv2
import numpy as np
from matplotlib import pyplot as plt
img = cv2.imread("1111.jpg")
hsv = cv2.cvtColor(img, cv2.COLOR_BGR2HSV)
lower_red = np.array([115, 0, 160])
upper_red = np.array([140, 30, 190])
mask = cv2.inRange(hsv, lower_red, upper_red)
res = cv2.bitwise_and(img, img, mask=mask)
# cv2.imshow('img', img)
cv2.imshow('mask', mask)
cv2.imshow('res', res)
cv2.waitKey(0)
cv2.destroyAllWindows()
如果对你有用的话,可以打赏哦
打赏


本文作者:Dong
本文链接:
版权声明:本博客所有文章除特别声明外,均采用 CC BY-NC。本作品采用《知识共享署名-非商业性使用 4.0 国际许可协议》进行许可。您可以在非商业用途下自由转载和修改,但必须注明出处并提供原作者链接。 许可协议。转载请注明出处!