获取地图块边界 融合dissolve geopandas
shapely介绍:
https://blog.csdn.net/wiborgite/article/details/85167397
geopandas介绍:
官方资料:https://geopandas.org/aggregation_with_dissolve.html
有一个geopandas的GeoDataFrame对象后:
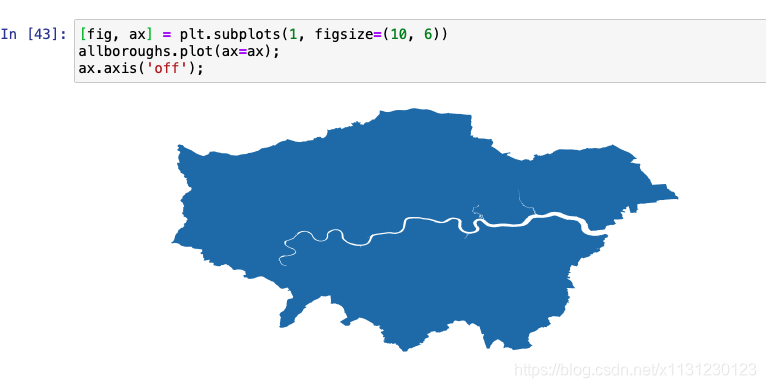
python展开代码g['all']=1
qq=g.dissolve(by="all",aggfunc="sum")
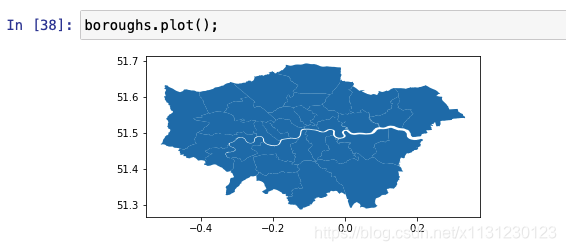
qq.plot()
plt.show()
f=qq.loc[1,"geometry"] #拿出图形
fg={"bianjie":list(f.exterior.coords)} #外环边界
print(list(f.interiors)) #内环
如果对你有用的话,可以打赏哦
打赏


本文作者:Dong
本文链接:
版权声明:本博客所有文章除特别声明外,均采用 CC BY-NC。本作品采用《知识共享署名-非商业性使用 4.0 国际许可协议》进行许可。您可以在非商业用途下自由转载和修改,但必须注明出处并提供原作者链接。 许可协议。转载请注明出处!