【卡尔曼滤波】用Python实现卡尔曼滤波效果,Python
目录
纯python
以下是一个简单的Python示例,演示了如何使用NumPy库实现一个一维卡尔曼滤波器。
python展开代码import numpy as np
import matplotlib.pyplot as plt
def kalman_filter(initial_state, initial_estimate_error, process_variance, measurement_variance, measurements):
num_measurements = len(measurements)
state_estimate = initial_state
estimate_error = initial_estimate_error
filtered_state_estimates = []
for i in range(num_measurements):
# Prediction step
predicted_state = state_estimate
predicted_estimate_error = estimate_error + process_variance
# Update step
kalman_gain = predicted_estimate_error / (predicted_estimate_error + measurement_variance)
state_estimate = predicted_state + kalman_gain * (measurements[i] - predicted_state)
estimate_error = (1 - kalman_gain) * predicted_estimate_error
filtered_state_estimates.append(state_estimate)
return filtered_state_estimates
# Generate some noisy measurements
np.random.seed(0)
true_values = np.linspace(0, 10, num=50)
measurements = true_values + np.random.normal(0, 0.5, size=len(true_values))
# Kalman filter parameters
initial_state = measurements[0]
initial_estimate_error = 1
process_variance = 0.1
measurement_variance = 0.5
# Apply Kalman filter
filtered_estimates = kalman_filter(initial_state, initial_estimate_error, process_variance, measurement_variance, measurements)
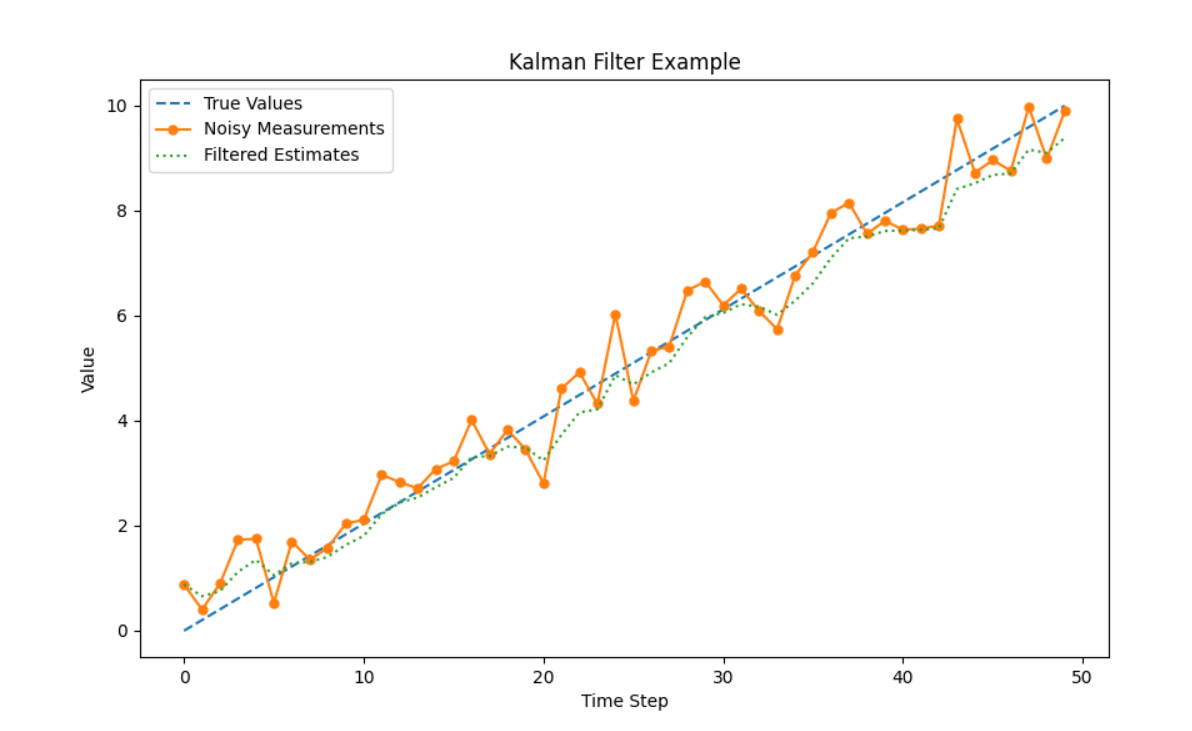
# Plot the results
plt.figure(figsize=(10, 6))
plt.plot(true_values, label='True Values', linestyle='dashed')
plt.plot(measurements, label='Noisy Measurements', marker='o', markersize=5)
plt.plot(filtered_estimates, label='Filtered Estimates', linestyle='dotted')
plt.legend()
plt.xlabel('Time Step')
plt.ylabel('Value')
plt.title('Kalman Filter Example')
plt.show()
卡尔曼滤波参数的含义如下:
-
initial_state: 初始状态估计值,通常设置为第一个测量值。在卡尔曼滤波开始时,您的系统的初始状态估计值。 -
initial_estimate_error: 初始状态估计误差,表示初始状态估计值的不确定性。通常设置为一个较大的值,以表示初始状态的不确定性。 -
process_variance: 过程方差,表示系统模型中状态转移的噪声或不确定性。较大的值表示系统模型中的不确定性较大。 -
measurement_variance: 测量方差,表示传感器测量的噪声或不确定性。较大的值表示测量值的不确定性较大。
在卡尔曼滤波中,这些参数的调整会影响滤波器的性能。例如,如果您预计系统模型比传感器测量更可靠,则可以适当减小measurement_variance。如果初始状态估计值的不确定性较大,您可以增加initial_estimate_error。调整这些参数可能需要一些试验和经验。
基于pykalman 库
go展开代码import numpy as np
import matplotlib.pyplot as plt
from pykalman import KalmanFilter
# Generate some noisy measurements
np.random.seed(0)
true_values = np.linspace(0, 10, num=50)
measurements = true_values + np.random.normal(0, 0.5, size=len(true_values))
# Create a Kalman Filter object
kf = KalmanFilter(initial_state_mean=measurements[0], n_dim_obs=1)
# Apply Kalman filter
filtered_state_means, _ = kf.filter(measurements)
# Plot the results
plt.figure(figsize=(10, 6))
plt.plot(true_values, label='True Values', linestyle='dashed')
plt.plot(measurements, label='Noisy Measurements', marker='o', markersize=5)
plt.plot(filtered_state_means, label='Filtered Estimates', linestyle='dotted')
plt.legend()
plt.xlabel('Time Step')
plt.ylabel('Value')
plt.title('Kalman Filter Example using pykalman')
plt.show()
如果对你有用的话,可以打赏哦
打赏


本文作者:Dong
本文链接:
版权声明:本博客所有文章除特别声明外,均采用 CC BY-NC。本作品采用《知识共享署名-非商业性使用 4.0 国际许可协议》进行许可。您可以在非商业用途下自由转载和修改,但必须注明出处并提供原作者链接。 许可协议。转载请注明出处!
目录