Python如何绘制直流电机开闭环特性曲线?matplotlib
目录
Python
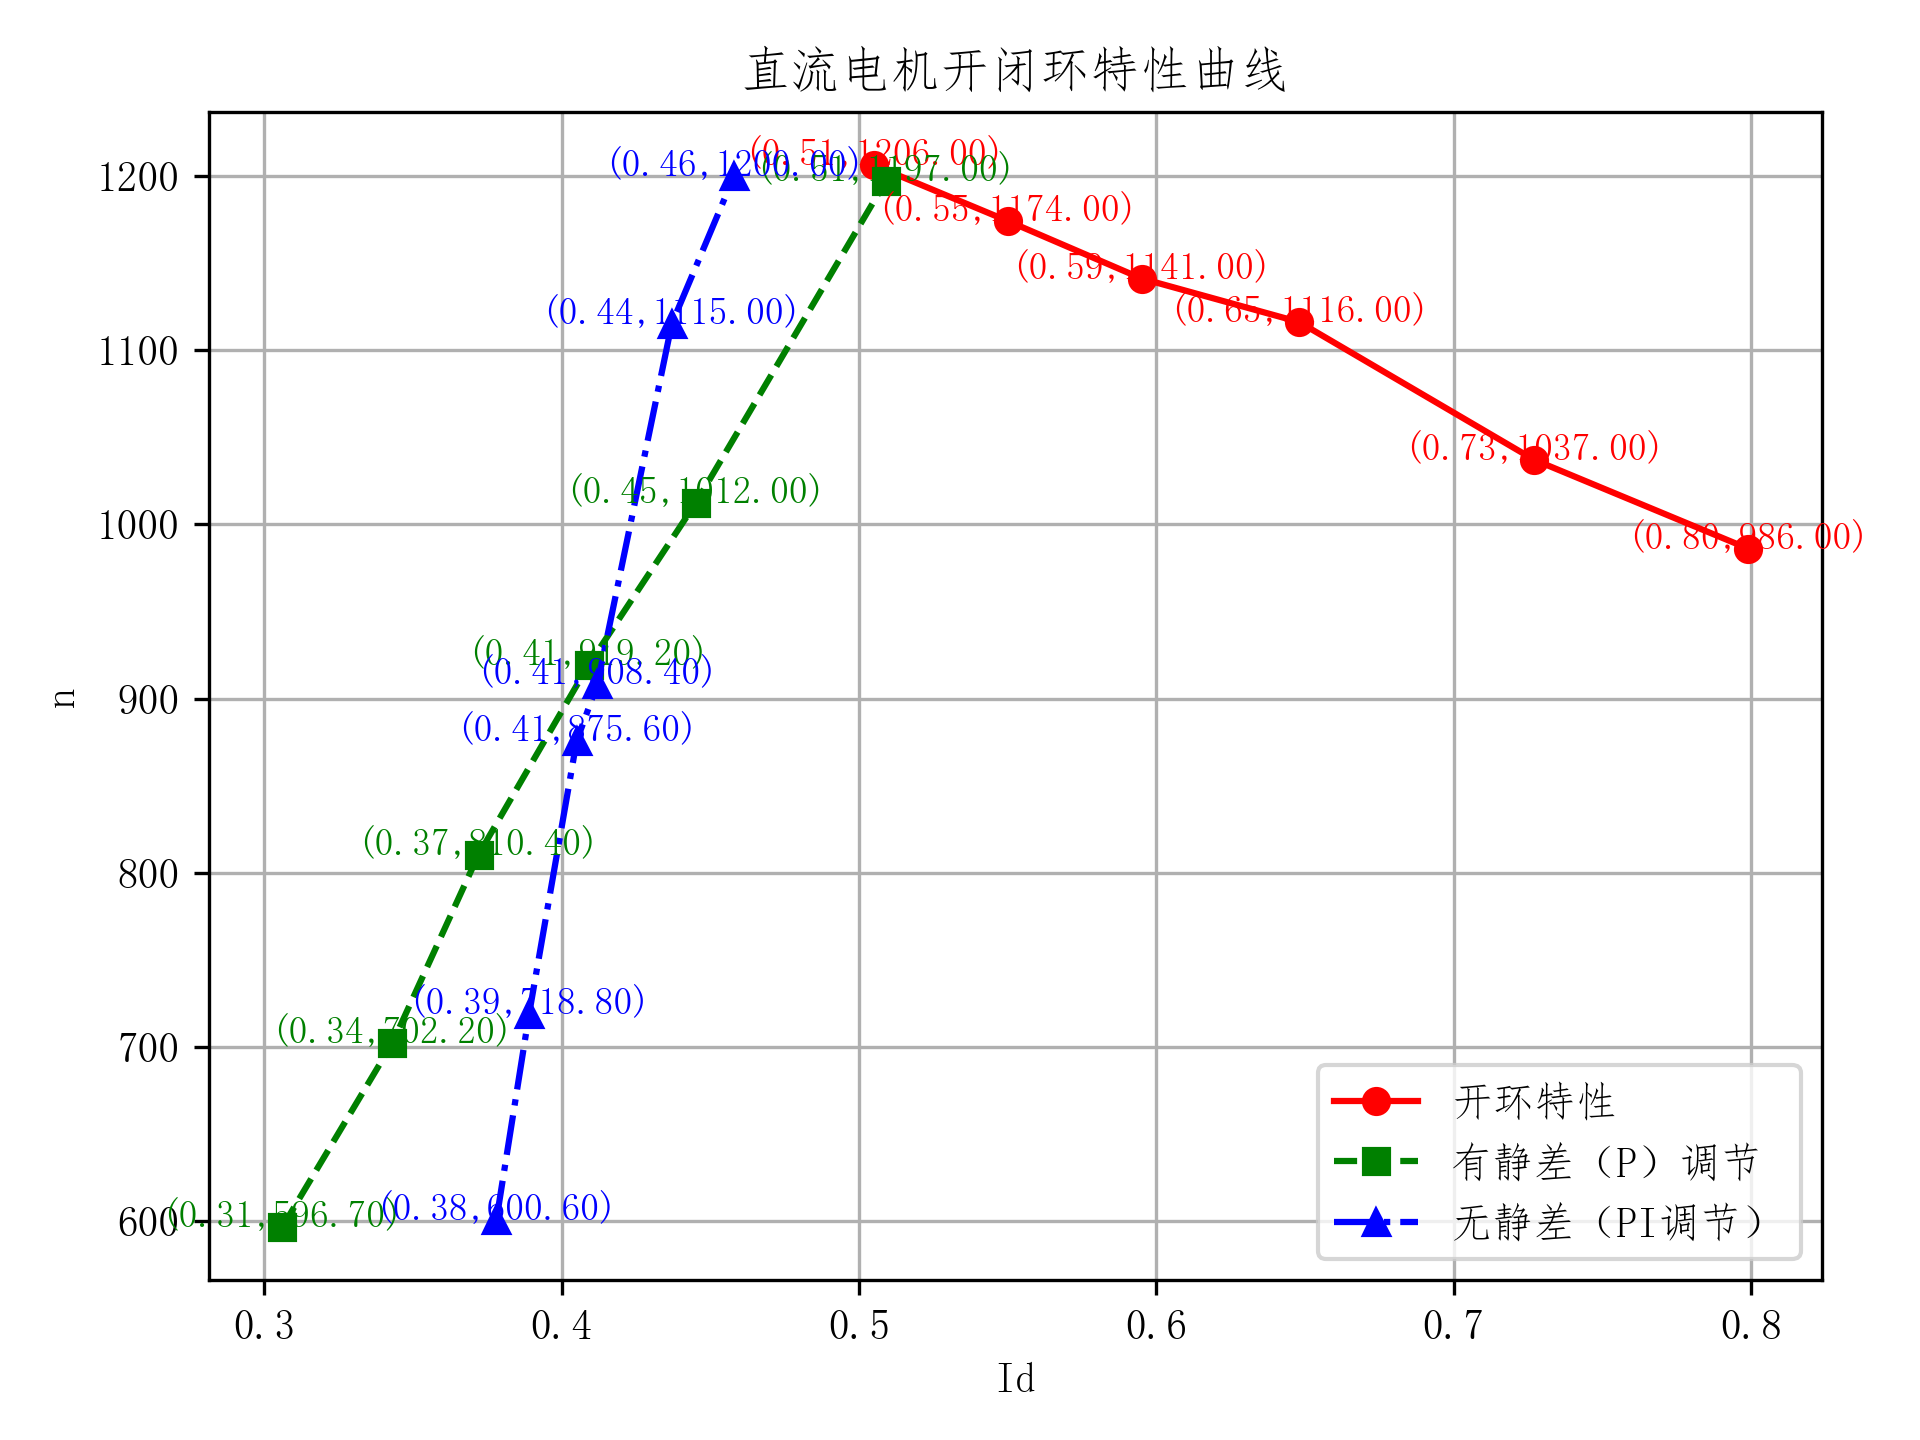
dart展开代码import matplotlib.pyplot as plt
from pylab import mpl
mpl.rcParams['font.sans-serif'] = ['FangSong']  # 指定默认字体
mpl.rcParams['axes.unicode_minus'] = False  # 解决保存图像是负号'-'显示为方块的问题
# 数据集1
n1 = [1206, 1174, 1141, 1116, 1037, 986]
Id1 = [0.505, 0.55, 0.595, 0.648, 0.727, 0.799]
# 数据集2
n2 = [596.7, 702.2, 810.4, 919.2, 1012, 1197]
Id2 = [0.306, 0.343, 0.372, 0.409, 0.445, 0.509]
# 数据集3
n3 = [600.6, 718.8, 875.6, 908.4, 1115, 1200]
Id3 = [0.378, 0.389, 0.405, 0.412, 0.437, 0.458]
# 绘制折线图
plt.figure()
# 开环特性      有静差(P)调节      无静差(PI调节)
# 数据集1折线
plt.plot(Id1, n1, marker='o', linestyle='-', label='开环特性', color='r')
for x, y in zip(Id1, n1):
    plt.text(x, y, f'({x:.2f},{y:.2f})', fontsize=9, horizontalalignment='center', color='r')
# 数据集2折线
plt.plot(Id2, n2, marker='s', linestyle='--', label='有静差(P)调节', color='g')
for x, y in zip(Id2, n2):
    plt.text(x, y, f'({x:.2f},{y:.2f})', fontsize=9, horizontalalignment='center', color='g')
# 数据集3折线
plt.plot(Id3, n3, marker='^', linestyle='-.', label='无静差(PI调节)', color='b')
for x, y in zip(Id3, n3):
    plt.text(x, y, f'({x:.2f},{y:.2f})', fontsize=9, horizontalalignment='center', color='b')
# 设置图表属性
plt.xlabel('Id')
plt.ylabel('n')
plt.title('直流电机开闭环特性曲线')
# lengend不要挡住字
plt.legend(loc='lower right')
plt.grid(True)
plt.tight_layout()
# save
plt.savefig("Id_vs_n.png", dpi=300)  # 设置dpi为300
# 显示图表
plt.show()
问询、帮助
你如果需要帮助,请看这里:
csharp展开代码https://docs.qq.com/sheet/DUEdqZ2lmbmR6UVdU?tab=BB08J2
如果对你有用的话,可以打赏哦
打赏


本文作者:Dong
本文链接:
版权声明:本博客所有文章除特别声明外,均采用 CC BY-NC。本作品采用《知识共享署名-非商业性使用 4.0 国际许可协议》进行许可。您可以在非商业用途下自由转载和修改,但必须注明出处并提供原作者链接。 许可协议。转载请注明出处!
目录